mobicité case study
Redesigning Mobicité's map page to surface historical parking availability patterns, so Montreal drivers can make smarter parking decisions before they leave home.
00
problem
Montreal drivers often do not know if parking is available until they are already searching. Mobicité, the city’s official parking app, records every street transaction by block, time, and day, but this data is not used to help future drivers. Instead, people rely on memory, Google Maps, or advice from others. The data exists but is currently used only for billing.
solution
Mobicité already includes a map page showing where parking is regulated. The solution does not replace this page; it adds a new layer: a probability-based heat map built from existing parking session logs that indicates which blocks are likely to have space at specific times of day.
User Research
I interviewed 20 Montreal drivers, aged 18 to 30, about their parking habits. None opened Mobicité before finding a spot. All used other methods first: memory, Google Maps, or word of mouth, and treated Mobicité solely as a payment tool. Some had stopped driving in busy neighbourhoods and switched to transit.
From research to redesign
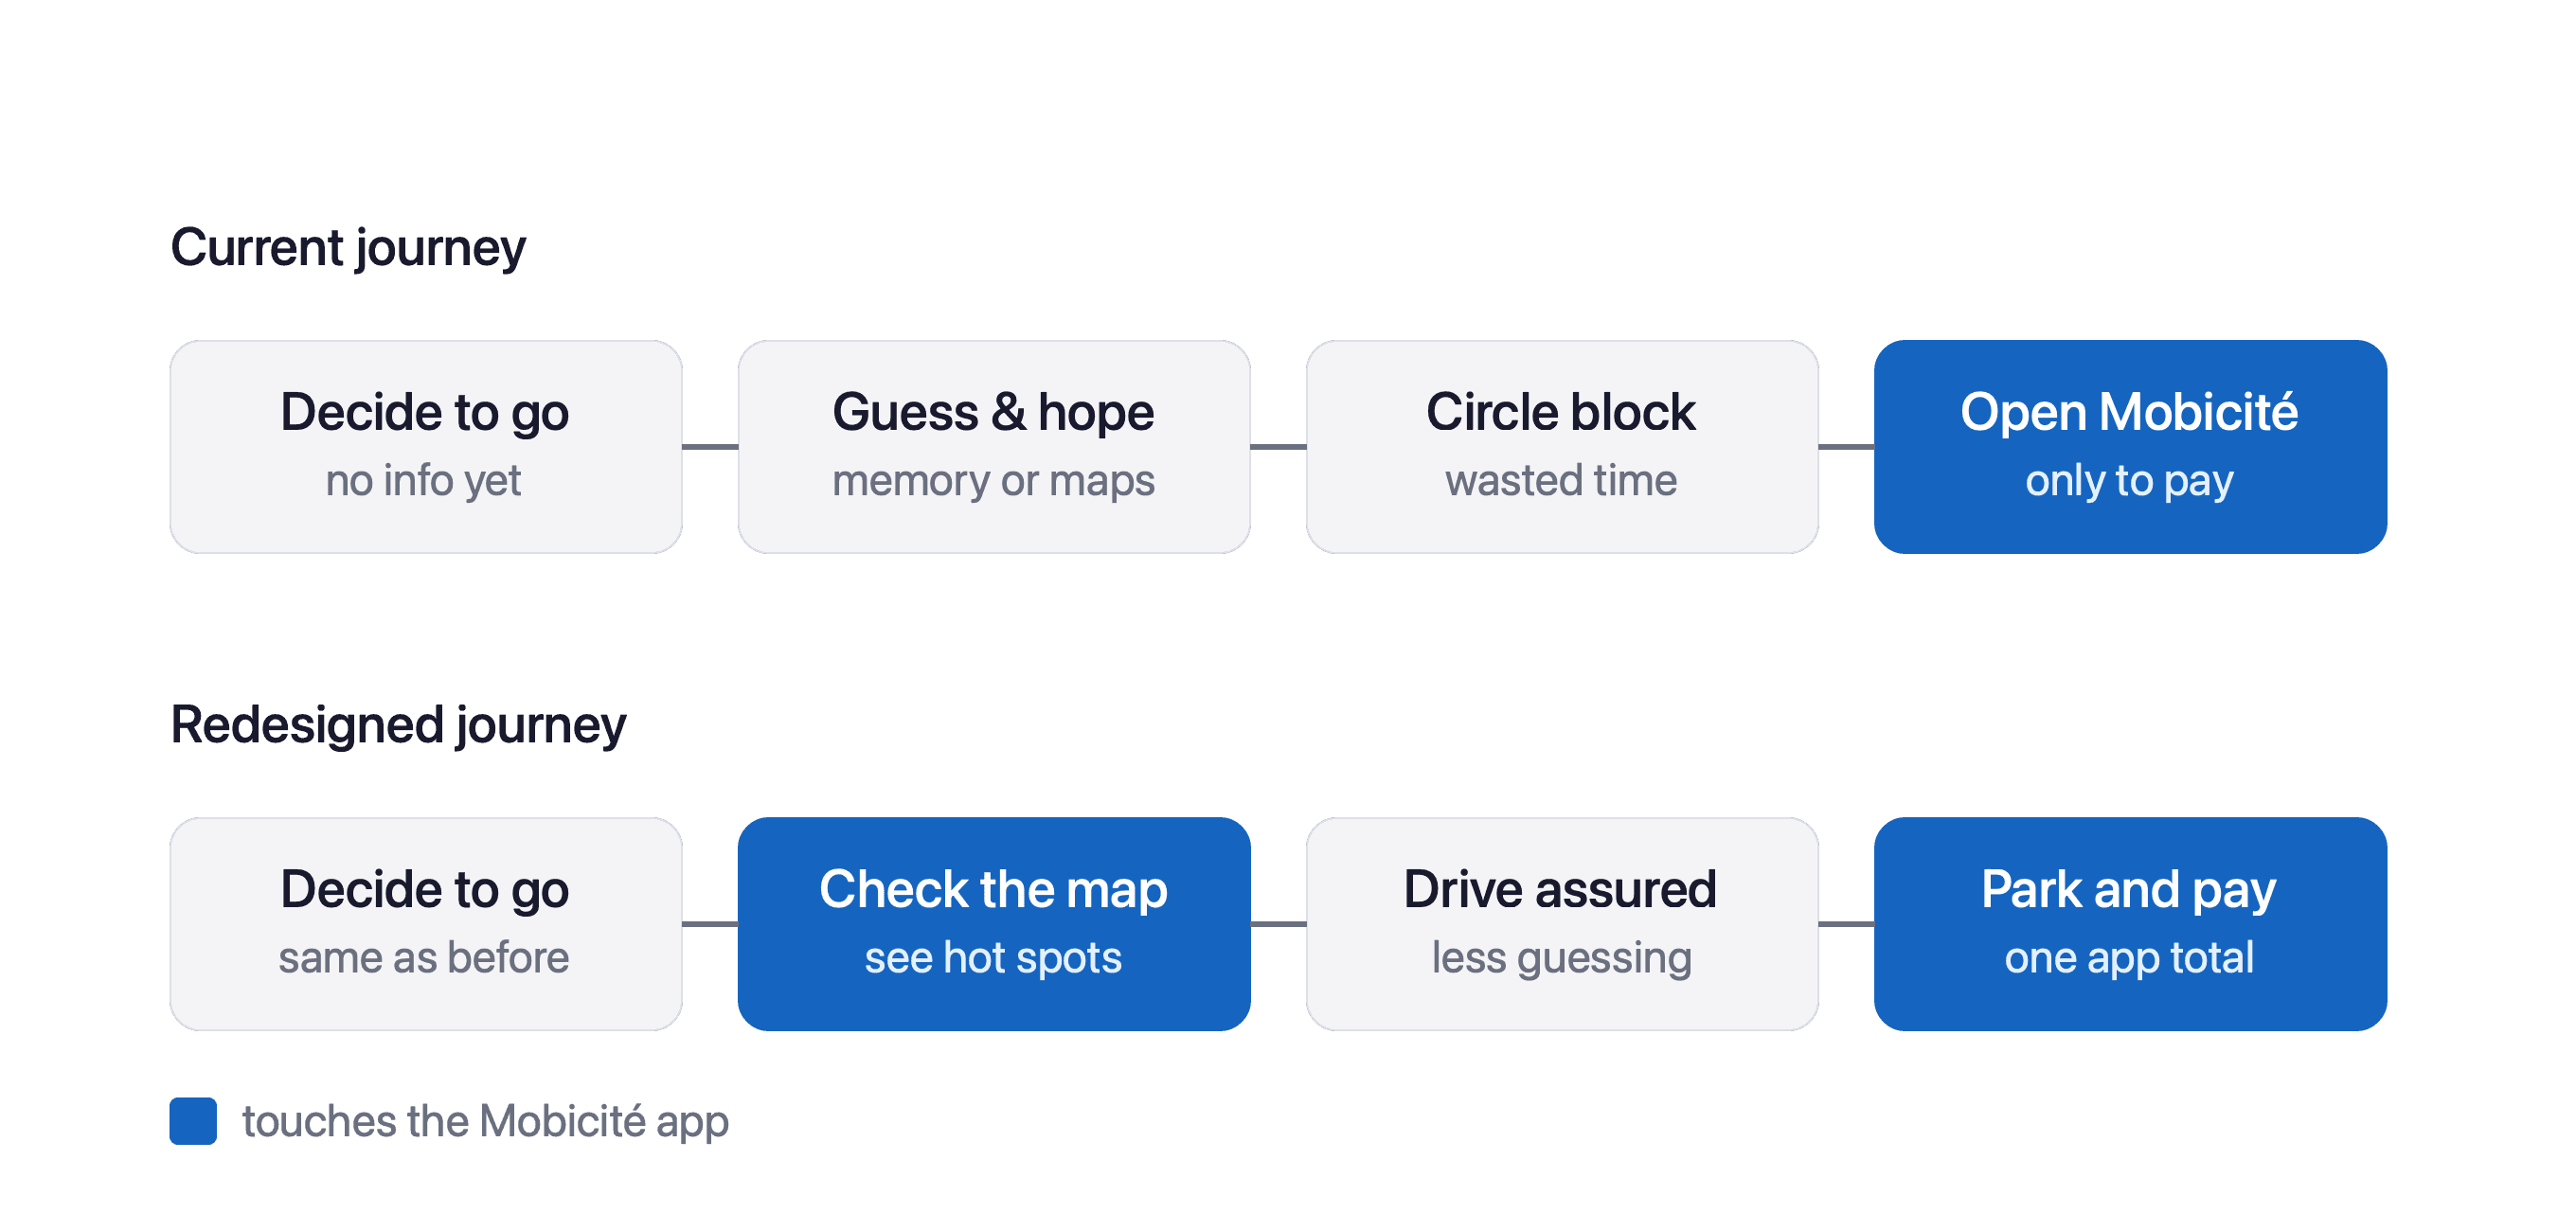
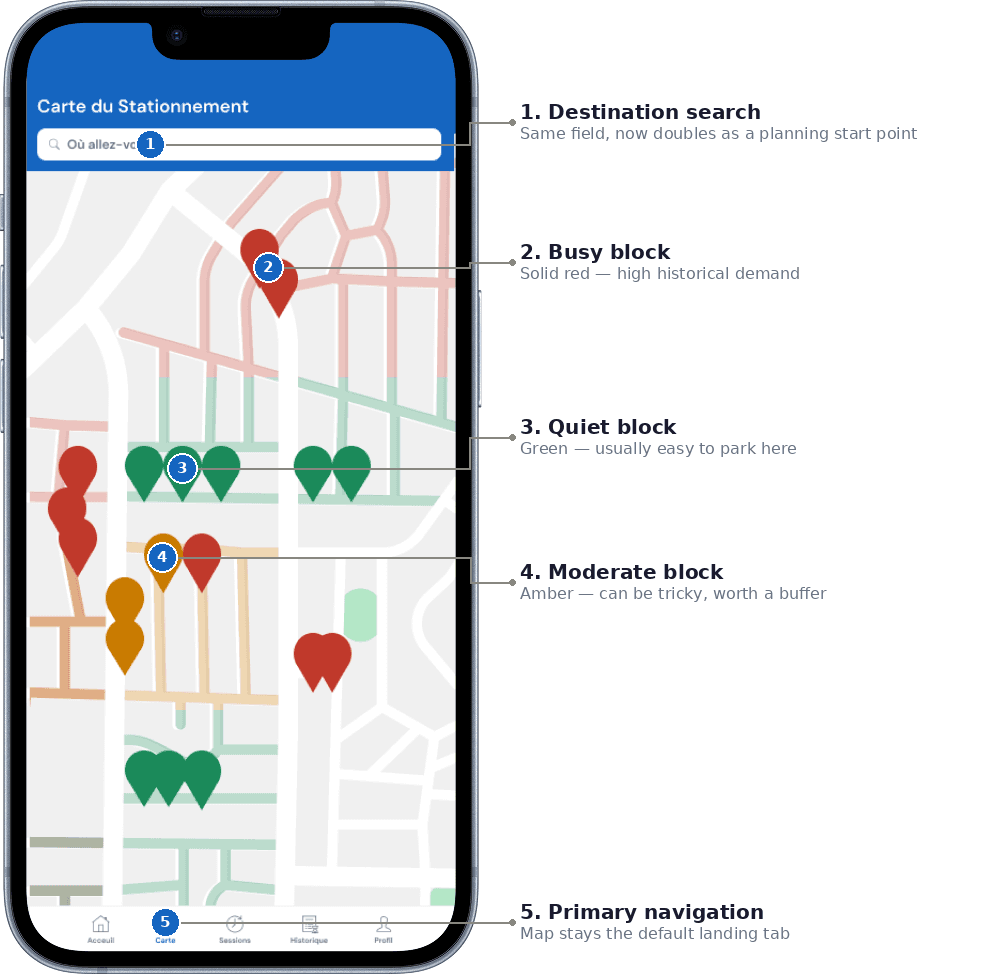
The fix isn’t a new feature. It’s moving an existing screen earlier in the trip. The map page already shows where parking is regulated. It just doesn’t show how likely you are to find a spot. Layering historical availability onto that same map turns Mobicité from a payment tool into a planning tool, without adding a single new screen.
Design objectives
Display neighbourhood-level availability patterns using existing app data
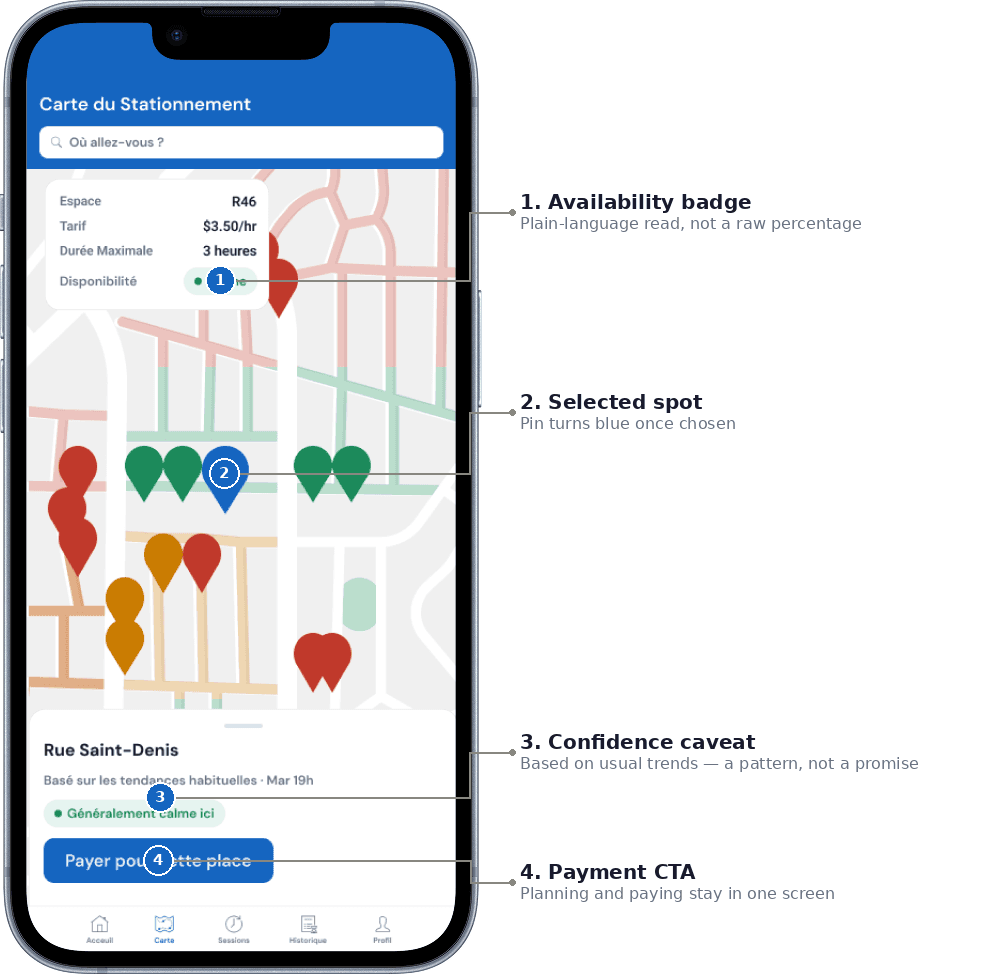
Enable drivers to check likely availability before leaving, rather than after they have started searching
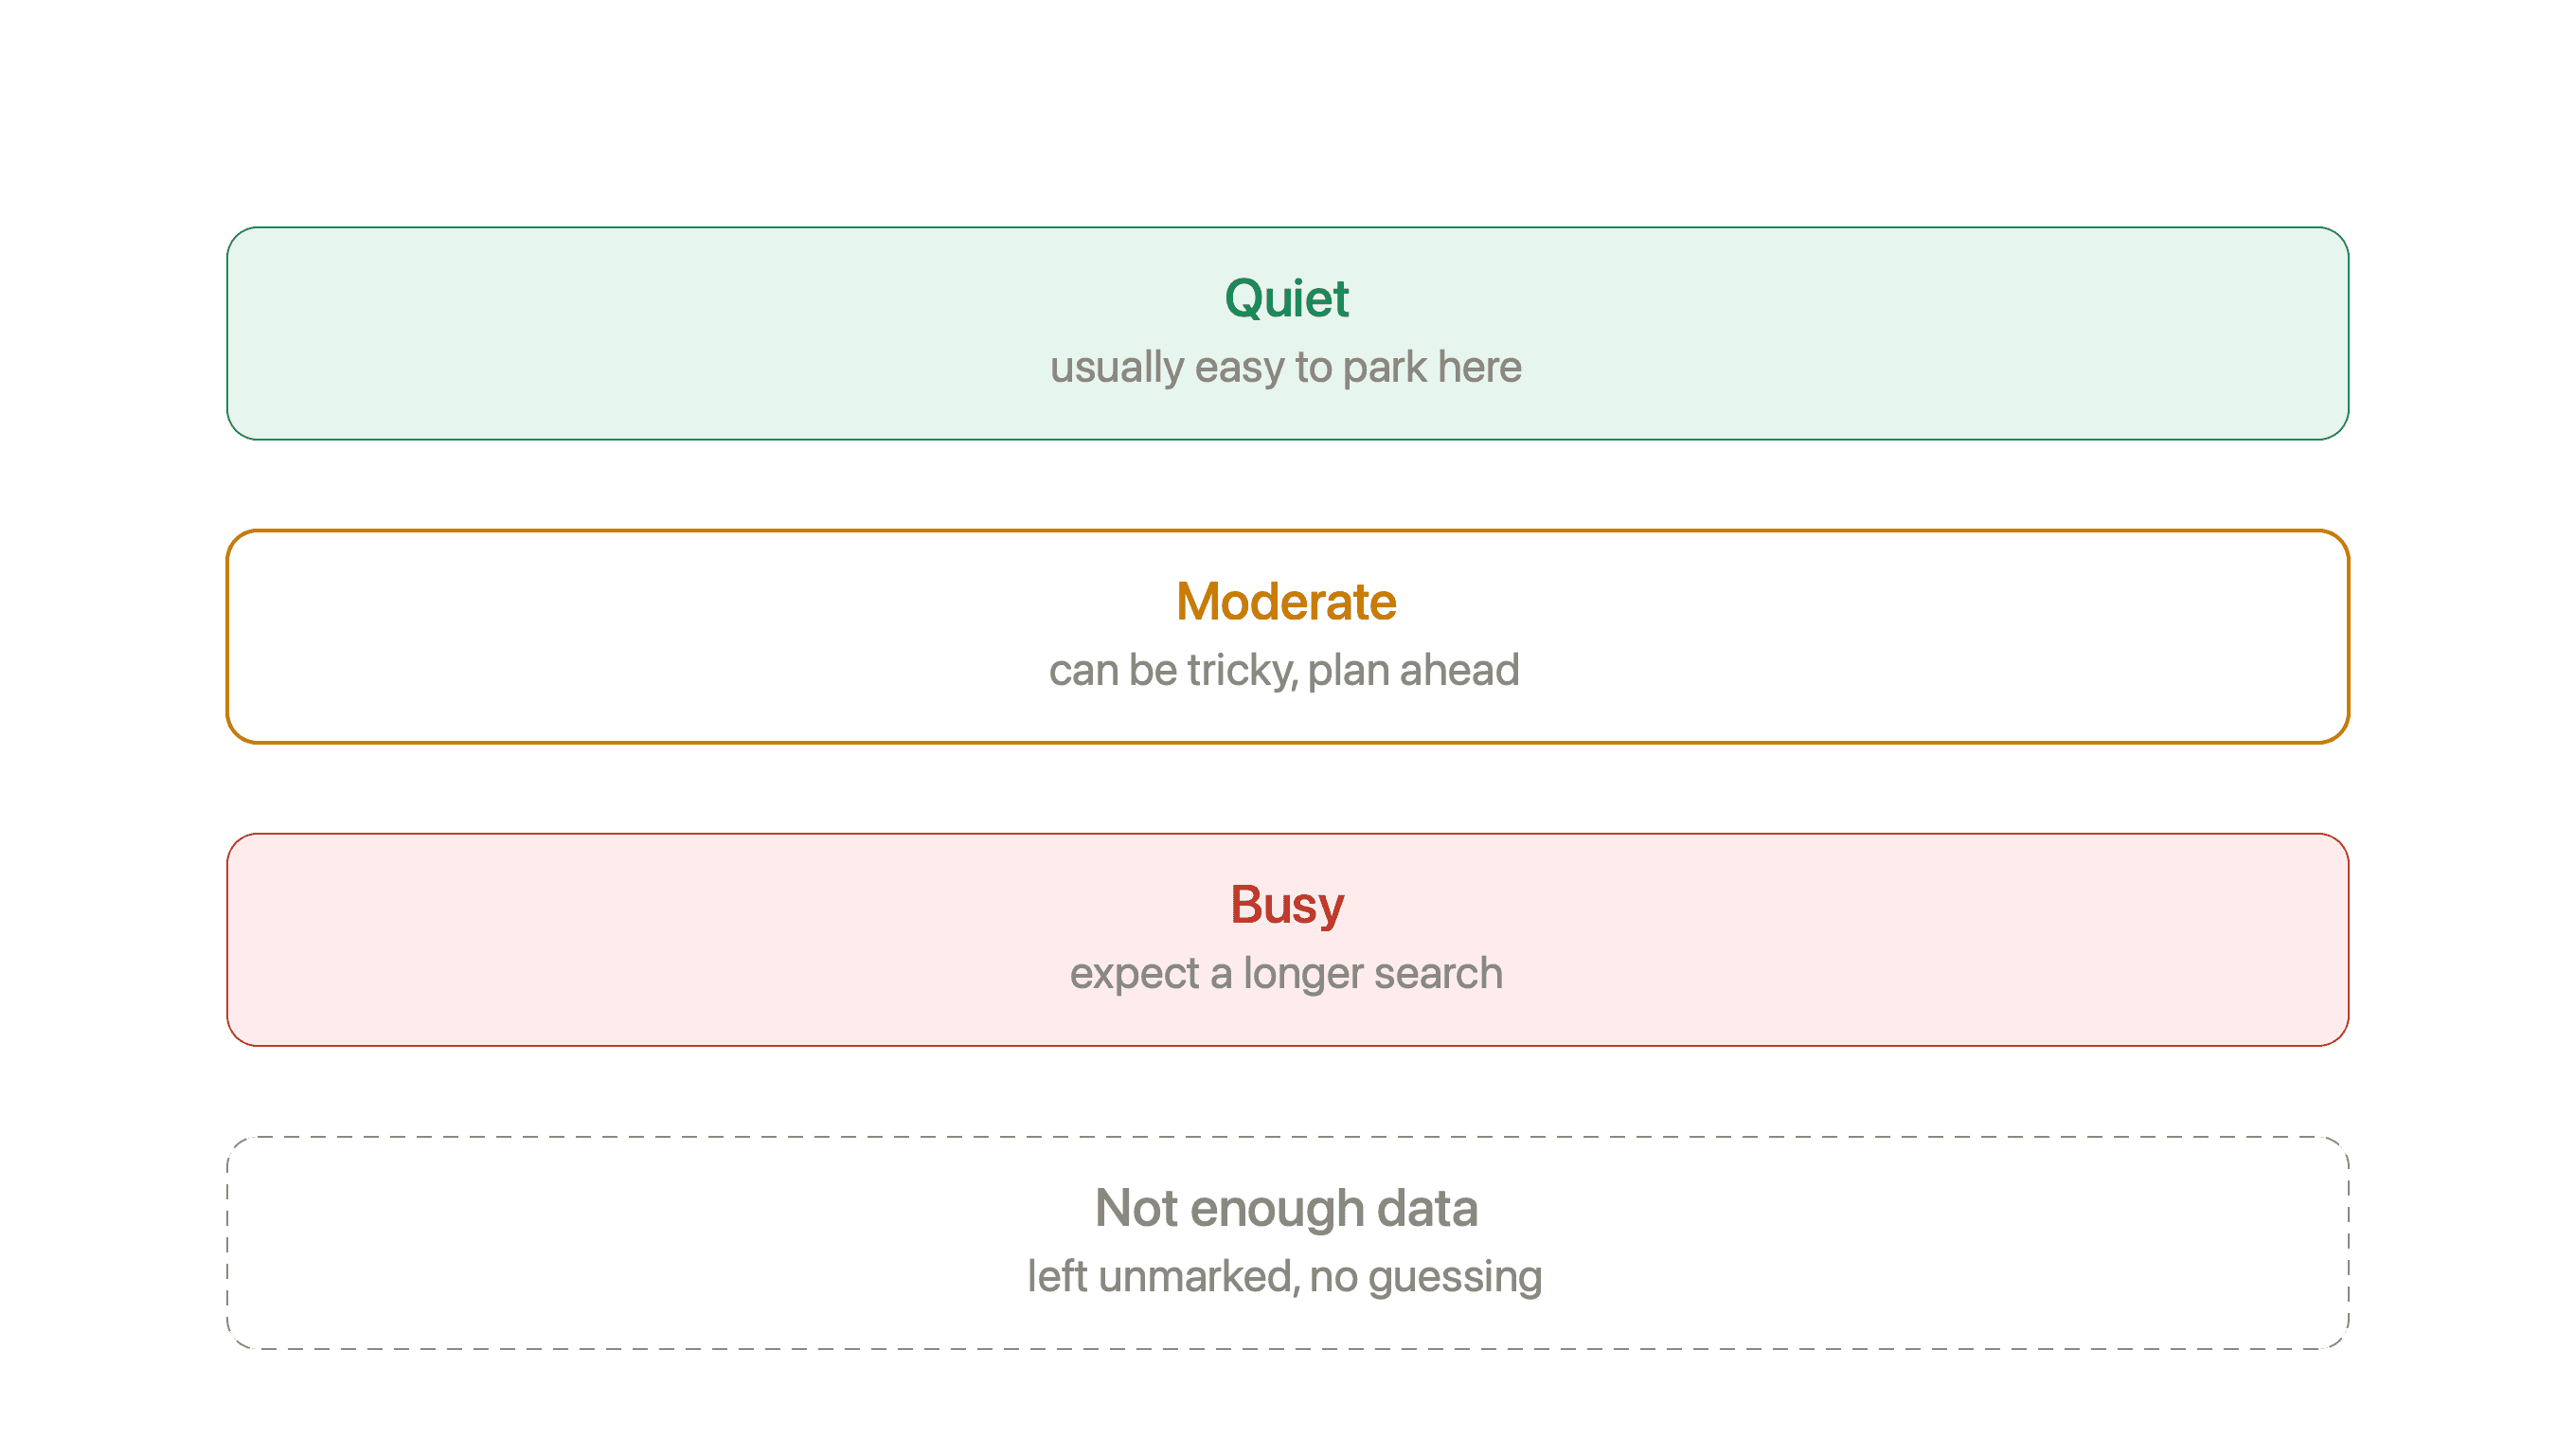
Communicate probability clearly using plain language and heat map styling, avoiding false precision
Maintain the map page as a unified tool for both planning and in-trip navigation
Leave blocks with insufficient data unmarked rather than estimate availability
Encourage drivers to use Mobicité throughout the entire process, from planning to payment
How it works
The heat map is not real-time and does not claim to be. It is built entirely from existing Mobicité data: every past parking session, tagged by block, time of day, and day of week. Aggregating this history by block and hour produces a probability score, which represents a pattern rather than a guarantee. This score determines the color displayed on the map.
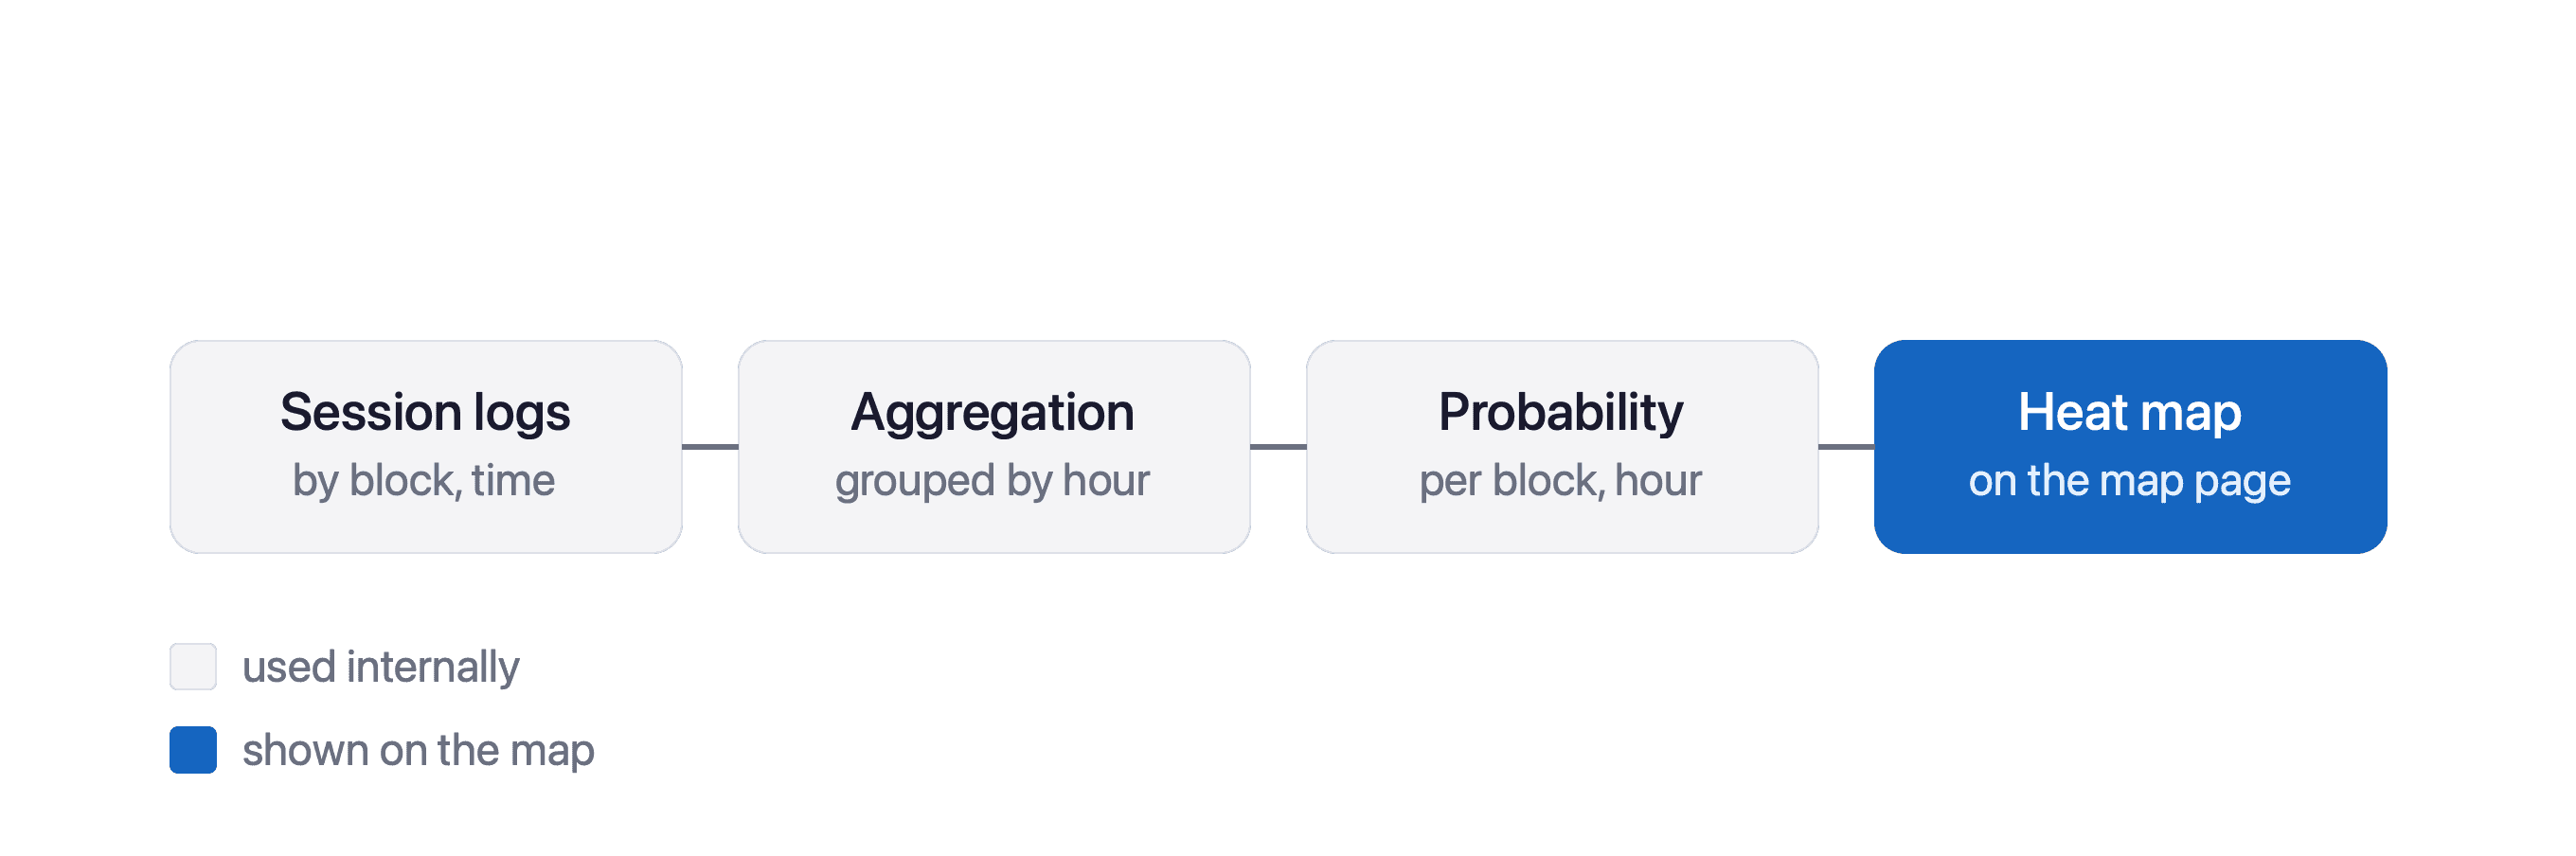
A pattern is not a promise, and the design must communicate this clearly. Blocks with sufficient historical data receive a confident color and a plain-language description. Blocks without enough data remain unmarked, rather than displaying unsupported estimates.
Design Features

year
2026
timeframe
16 days
tools
Figma
category
UI/UX